Difference between revisions of "Holonomy Project"
| Line 47: | Line 47: | ||
[[Category:Projects]] | [[Category:Projects]] | ||
__NOTOC__ | __NOTOC__ | ||
Revision as of 17:47, 15 March 2020
Title
Holonomy Project
Project Manager
serenedesiree#0956
Team Members
- serenedesiree#0956 - Project Lead
- Tim FH#7940 - Mathematics Lead
- Ben C#7492 - Programming Lead
Prod URL
TBD
Dev URL
TBD
GitHub URL
https://github.com/serenedesiree/Models (private)
Documentation URL
https://github.com/serenedesiree/Models/blob/master/README.md (private)
Description
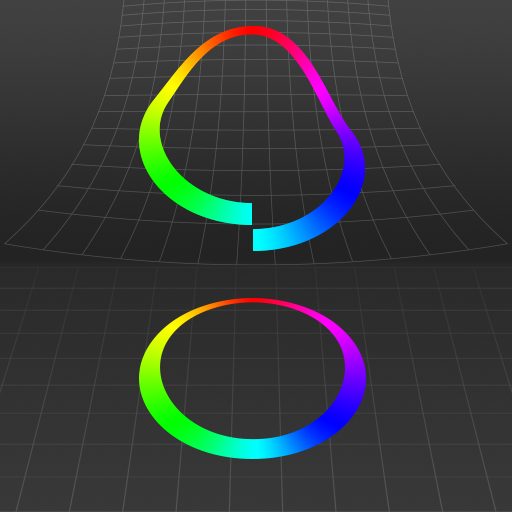
[Programming Lead's Best Attempt Effort] Interactive demos highlighting the concept of holonomy: where a calm ("parallel transport"), round trip path traveled following "straightest" paths (geodesics) reveals deep information about the curvature of the space itself.
Long Description
[Programming Lead's Best Stab]
Gauge theory allows us to map from one space to another, essentially allowing exploration in the second space via traversing the original space. The position in the original space sets the foundations and assumptions of the second space, and by allowing that position to vary, we can move beyond fixed assumptions (such as, preferences are fixed in computing the consumer price index in Economics) to a mathematics that expresses the true underlying richness available across all of Physics, Economics, and other fields.
This project provides a suite of interactive visualizations, aiming to share intuitions about the core concepts that are gatekeepers to understanding Gauge theory: multi-variable calculus, curvature, fiber bundles, and fibration. Intuition is built by implementing these concepts in things we can see and manipulate: 2D and 3D objects.
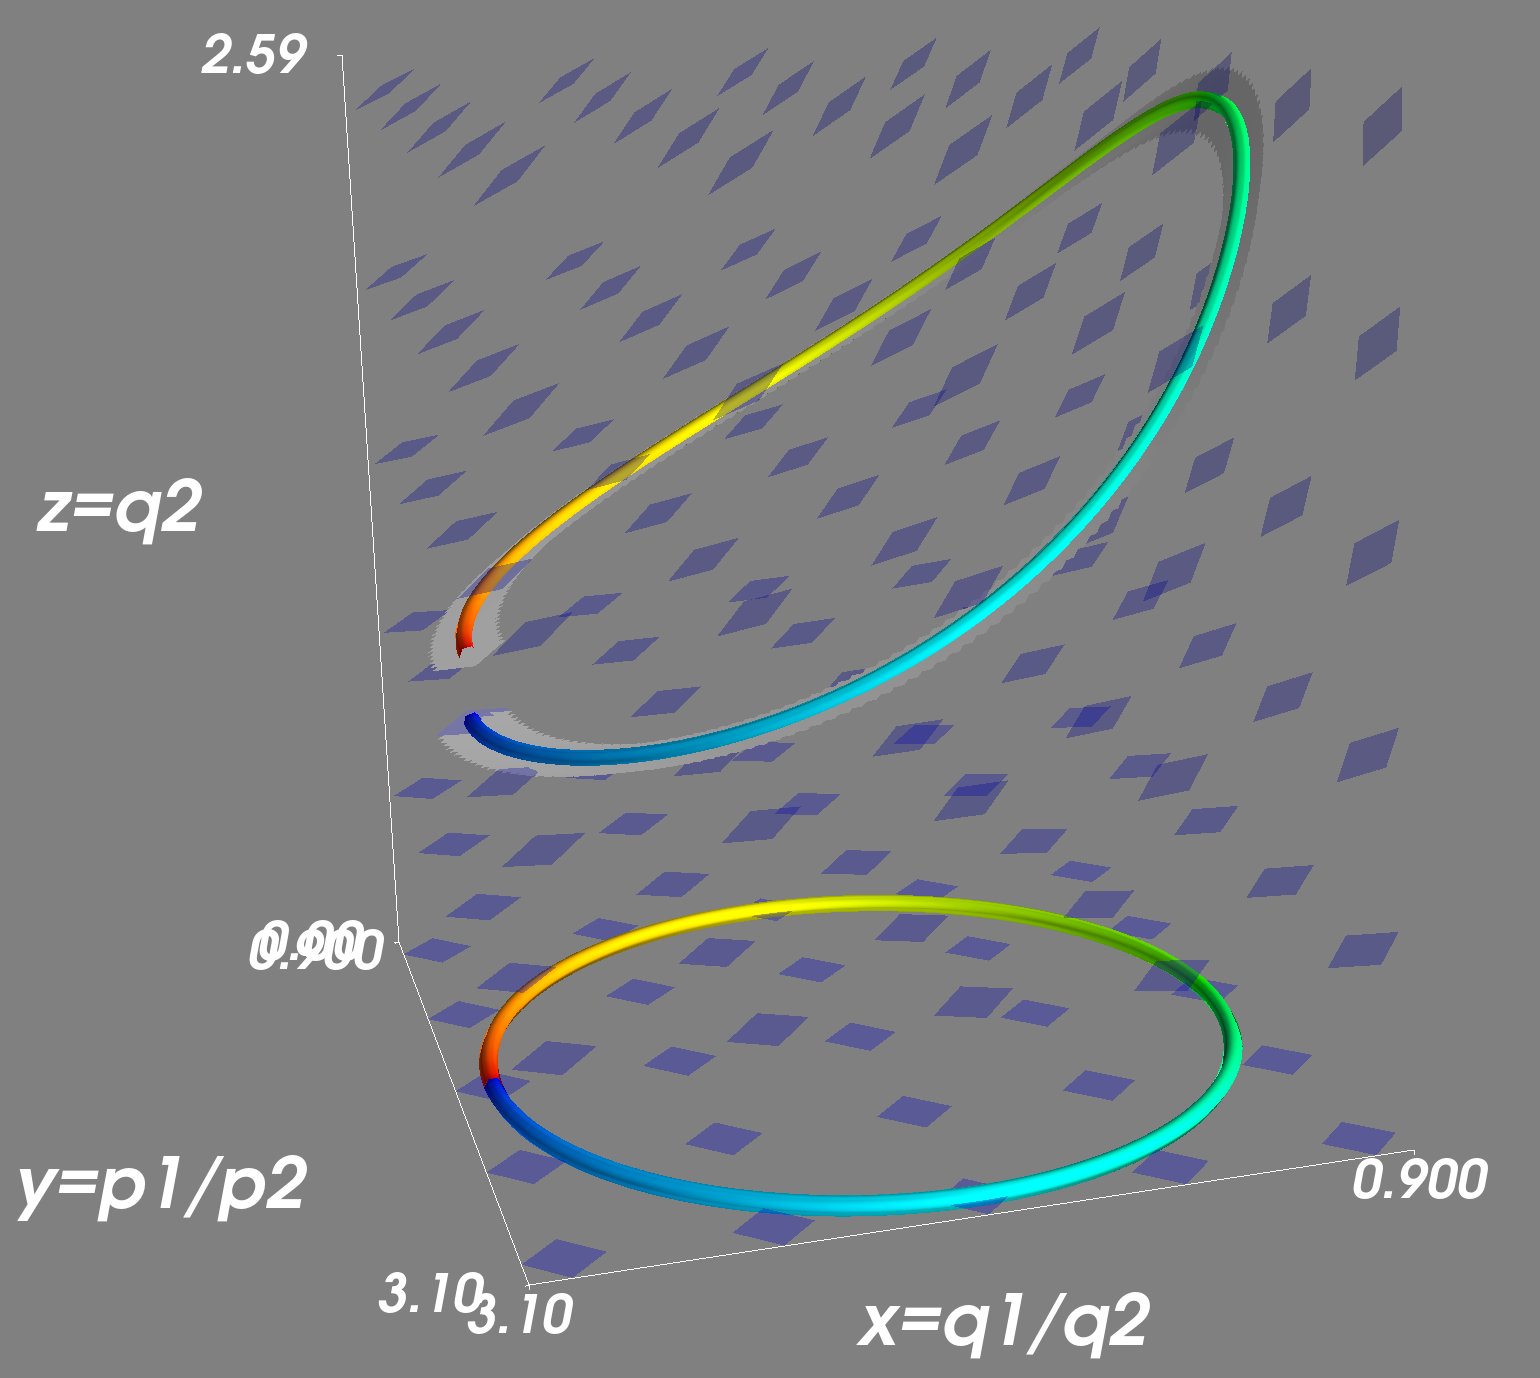
Currently, we have a Python demo that shows how we can map from a 2D space into 5D: a 3D space with 2D vectors at each point. The visualization follows the 2D original space (x and y plane) as it varies in time, and shows the total amount of curvature (holonomy; z plane) experienced by a special kind of round-trip in the mapped space. Attached at each point, it also shows the curvature of the output space (otherwise, not visualized) associated with that point, to give a sense of how curvature is generating the holonomy measured at each point along the original space.
Demo

Screenshots

Cover Image
